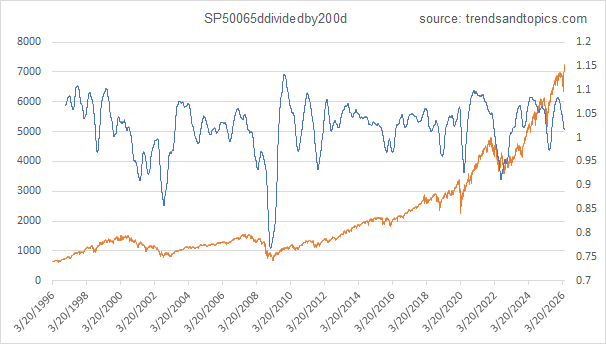
The 65-day SMA of the SP500 divided by the 200-day SMA is interesting. A value 1.09 or above has generally been associated with an advancing market. A value of 0.925 or below has been associated with a market bottom.
Trends and Topics
The 65-day SMA of the SP500 divided by the 200-day SMA is interesting. A value 1.09 or above has generally been associated with an advancing market. A value of 0.925 or below has been associated with a market bottom.

The NASDAQ High Low Index has forged to record levels. Here is a current chart, showing the Index versus the NASDAQ price. For the sake of clarity, only the days that the Index has been over a value of 0.0225 are shown. An explanation of the derivation of the Index can be found in the 2nd Edition of Robert Colby's 'The Encyclopedia of Technical Market Indicators'. Decide for yourself the degree to which this Index correlates with market tops.

Here's a TRIN chart using NYSE data. There has been no TRIN value over 4 since 12/28/2011. A low TRIN for an index occurs on a day when there is a small down volume diffused over many declining issues, while on the same day there is a large up volume which is concentrated in just a few issues. This is compatible with the fact that the capitalization of the top 10 companies was 15% of total market capitalization in 2011, growing to 36% in 2026